Until it became common practice in the last decade to offer stock options to a relatively broad spectrum of employees, most people were content to receive stock options at all. Now, more savvy about compensation if bruised by the market downturn, employees more typically wonder whether the options they are offered are competitive with what they should expect from an employer in their industry, for an employee in their position. As more information has become available about the practices and functions of stock options, employees need solid data on stock options grant practices. We has researched the trends in high-tech companies during the dot-com boom.

In a Start-Up, It’s Not How Many; It’s What Percentage
Particularly in high-tech start-up companies, it is more important to know what percentage of the company a stock option grant represents than it is to know how many shares you get. “Don’t get caught up in the numbers,” said Keith Fortier, a compensation consultant with us. “In a start-up, the meaning is in the percentages.”
In a publicly traded company, you can multiply the number of options times the current stock price, then subtract out the number of shares times your purchase price, to get a quick sense of how much the options are worth.
In a younger company – where shares are less liquid – it is harder to calculate what your options are worth, although they are likely to be worth more if the company does well than the options you might get in a publicly traded company. If you calculate what percentage of the company you own, you can create scenarios for how much your shares could be worth as the company grows. That’s why the percentage is an important statistic.
To calculate what percentage of the company you are being offered, you need to know how many shares are outstanding. One our user was able to negotiate an extra week of vacation because he asked his prospective employer this question.
The value of a company – also known as its market capitalization, or “market cap”—is the number of shares outstanding times the price per share. A start-up company might be valued at $2 million when an early employee joins the firm, but attain a value of $20 or even $200 million just a year or two later. Knowing that there are 20 million shares outstanding makes it possible for a prospective manufacturing engineer to gauge whether a hiring grant of 7,500 options is fair.
Some companies have relatively large numbers of shares outstanding so that they can give options grants that sound good in terms of whole numbers. But the savvy candidate should determine whether the grant is competitive in terms of the percentage of the company the shares represent. A grant of 75,000 shares in a company that has 200 million shares outstanding is equivalent to a grant of 7,500 shares in an otherwise identical company with 20 million shares outstanding.
In the example above, the manufacturing engineer’s grant represents 0.038 percent of the company. This percentage may look small, but it translates into a grant value of $750 for the stock if the company is worth $2 million; $7,500 if the company is worth $20 million; and $75,000 if the company is worth $200 million.
Annual Grants vs. Hire Grants in High-Tech Companies
Although stock options can be used as incentives, the most common types of options grants are annual grants and hire grants. An annual grant recurs each year until the plan changes, while a hire grant is a one-time grant. Some companies offer both hire grants and annual grants. These plans are usually subject to a vesting schedule, where an employee is granted shares but earns the right of ownership (i.e.—the right to exercise them) over time.
Recurring annual grants are usually paid to more senior people, and are more common in established companies where the share price is more level.
In start-ups, the hire grant is considerably larger than any annual grant, and may be the only grant the company offers at first. When a company starts out, the risk is highest, and the share price is lowest, so the options grants are much higher. Over time, the risk decreases, the share price increases, and the number of shares issued to new hires is lower.
Option Grants by Management Tier
A good rule of thumb is that each tier in the organization should get half of the options of the tier above it. For example, in a company where the CEO gets a hiring grant of 400,000 shares, the option grants might look like this:
| Position | Number of Shares |
| CEO | 400,000 |
| Senior VP | 200,000 |
| VP | 100,000 |
| Director | 50,000 |
| Manager | 25,000 |
| Level 2 | 12,500 |
| Entry-Level | 6,250 |
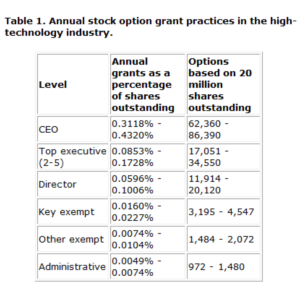
Tables 1 and 2 show recent grant practices among high-tech firms that offer annual grants and hire grants, respectively. The data, which comes from published surveys, is expressed in terms of percentages of the company. For illustration, the grants are also expressed in terms of number of options in a company with 20 million shares outstanding. The dataset includes both start-ups and established companies, especially companies just prior to and just after an IPO.
Note that it is rare for a stock options grant to someone other than a CEO to exceed 1 percent. (Founders typically retain a significantly larger percentage of the company, but their shares are not included in the data.) To take an extreme example, if 100 employees were granted an average of 1 percent of the company each, there would be nothing left for anyone else.
| Level | Hire grants as a percentage of shares outstanding | Options based on 20 million shares outstanding |
| Officers | ||
| CEO | 0.781% – 2.513% | 156,270 – 502,650 |
| COO | 0.322% – 0.926% | 64,340 – 185,190 |
| CFO | 0.204% – 0.616% | 40,830 – 123,160 |
| CTO | 0.110% – 0.495% | 21,950 – 99,050 |
| Senior EVP | 0.205% – 0.751% | 41,070 – 150,280 |
| Senior sales | 0.121% – 0.572% | 24,280 – 114,450 |
| Senior marketing | 0.138% – 0.482% | 27,530 – 96,470 |
| Senior operations | 0.125% – 0.485% | 24,910 – 96,940 |
| Senior professional services | 0.091% – 0.386% | 18,160 – 77,180 |
| Senior R&D | 0.121% – 0.463% | 24,190 – 92,680 |
| Senior engineering | 0.224% – 0.615% | 44,800 – 123,090 |
| SBU executive | 0.100% – 0.287% | 20,030 – 57,360 |
| Legal counsel | 0.064% – 0.236% | 12,830 – 47,190 |
| Senior administration | 0.071% – 0.137% | 14,200 – 27,330 |
| Senior HR | 0.048% – 0.183% | 9,670 – 36,580 |
| Senior IS | 0.047% – 0.106% | 9,330 – 21,230 |
| Senior manufacturing | 0.032% – 0.102% | 6,410 – 20,390 |
| Directors | ||
| 2nd level – engineering | 0.040% – 0.126% | 7,910 – 25,160 |
| 2nd level – financial | 0.045% – 0.141% | 8,970 – 28,250 |
| Controller | 0.044% – 0.142% | 8,790 – 28,470 |
| 2nd level – marketing | 0.039% – 0.105% | 7,700 – 21,000 |
| Senior QA | 0.034% – 0.089% | 6,810 – 17,820 |
| Senior tech. staff | 0.025% – 0.105% | 5,030 – 20,910 |
| 2nd level – prof. svcs. | 0.023% – 0.106% | 4,660 – 21,140 |
| 2nd level – R&D | 0.023% – 0.091% | 4,650 – 18,160 |
| Treasurer | 0.030% – 0.082% | 5,900 – 16,360 |
| Assoc. legal counsel | 0.017% – 0.103% | 3,390 – 20,550 |
| 2nd level – IS | 0.015% – 0.065% | 2,910 – 12,940 |
| Facilities/real estate | 0.016% – 0.045% | 3,140 – 8,900 |
| Managers | ||
| 3rd level – engineering | 0.017% – 0.071% | 3,430 – 14,100 |
| 3rd level – marketing | 0.018% – 0.064% | 3,650 – 12,870 |
| HR – comp/benefits | 0.012% – 0.034% | 2,320 – 6,740 |
| Accounting manager – entry | 0.006% – 0.031% | 1,200 – 6,110 |
| Lead – Tech | ||
| Test engineer | 0.020% – 0.070% | 3,930 – 14,070 |
| Manufacturing engineer | 0.017% – 0.061% | 3,370 – 12,120 |
| Technical support | 0.020% – 0.060% | 3,960 – 11,900 |
| Sales Reps | ||
| Senior | 0.009% – 0.034% | 1,750 – 6,810 |
| Entry | 0.003% – 0.011% | 580 – 2,100 |
| Other Exempt | ||
| Exempt technical (senior) | 0.012% – 0.045% | 2,310 – 8,977 |
| Exempt technical (intermediate) | 0.006% – 0.025% | 1,170 – 5,020 |
| Exempt technical (entry) | 0.003% – 0.011% | 630 – 2,210 |
| Exempt nontechnical (senior) | 0.004% – 0.016% | 830 – 3,100 |
| Exempt nontechnical (intermediate) | 0.003% – 0.010% | 527 – 2,070 |
| Exempt nontechnical (entry) | 0.002% – 0.005% | 350 – 1,060 |
Ownership Percentages at a Liquidity Event
As a company prepares for an initial public offering, a merger, or some other liquidity event (a financial moment at which shareholders are able to sell, or liquidate, their shares), the ownership structure typically shifts somewhat. At an IPO, for example, high-profile senior executives are usually brought in to provide additional credibility and management insight.
“Wall Street, investment bankers, and the financial community as a whole look at the management team when evaluating an investment opportunity,” said Coleman. “Employees who have been there since the beginning are sometimes surprised to see large numbers of options being given out near the IPO, but they should expect it. Although it dilutes their ownership, it’s done to increase the value of the company by enticing the highest caliber of senior managers and thus improving the potential of the investment.”
The people who design stock option plans anticipate liquidity events by setting aside large reserves of options for these late-stage hires. As a result, the ownership structure of a high-tech company at a liquidity event resembles that in Table 3. Again, the numbers are expressed in terms of both percentage of shares outstanding and number of shares in a company with 20 million shares outstanding. The data comes from published surveys and from analysis of S-1 filings.
Fortier emphasized that it’s important to bear in mind the changes in compensation practices over time. “This data reflects grant practices during the dot-com boom,” he said. “The new numbers for 2001 have not been tallied yet, but I wouldn’t be surprised if there were some shift in the makeup of compensation packages in industries across the board.” Ironically, however, he said, “It is precisely when the stock market is down…that you ideally want to negotiate for more options.”
Table 3. Ownership levels at a liquidity event in the high-tech industry.
| Level | Ownership levels as a percentage of shares outstanding | Ownership based on 20 million shares outstanding |
| President and CEO | 2.40% – 4.60% | 480,000 – 920,000 |
| Vice presidents (all) | 0.25% – 1.95% | 50,000 – 390,000 |
| VP, CFO | 0.80% – 1.60% | 160,000 – 320,000 |
| VP, engineering | 1.15% – 1.95% | 230,000 – 390,000 |
| VP, operations | 0.70% – 1.50% | 140,000 – 300,000 |
| VP, HR | 0.25% – 1.05% | 50,000 – 210,000 |
| VP, general counsel | 0.50% – 1.30% | 100,000 – 260,000 |
| VP, marketing | 0.40% – 1.20% | 80,000 – 240,000 |
| VP, sales | 0.80% – 1.60% | 160,000 – 320,000 |
| Directors | 0.10% – 1.00% | 20,000 – 200,000 |
| Managers | 0.03% – 0.50% | 6,000 – 100,000 |
| Senior contributors | 0.03% – 0.20% | 6,000 – 40,000 |
| Intermediate contributors | 0.02% – 0.07% | 4,000 – 14,000 |
| Entry contributors | 0.01% – 0.05% | 2,000 – 10,000 |
| Nonexempt | 0.01% – 0.03% | 2,000 – 6,000 |